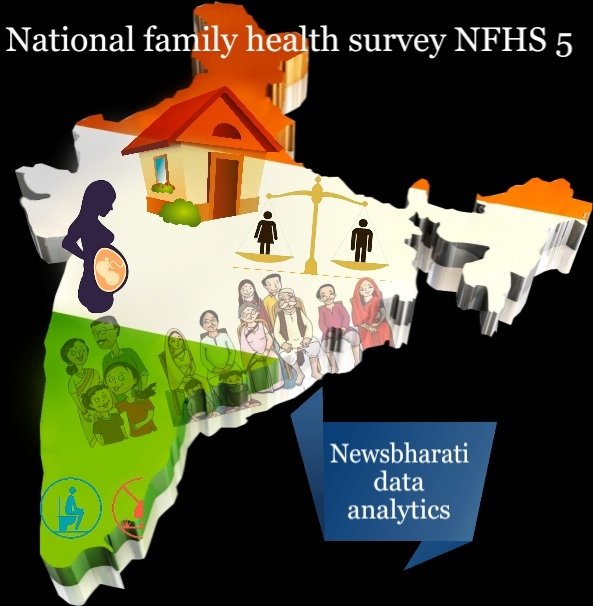
Mapping the social progress: reflections of National family health survey
17 Feb 2022 10:28:09
Newsbharati is happy to introduce the interactive map on a very valuable social data.

The NFHS 5 has collected data on 131 social indicators. As compared to NFHS4, 31 new indicators were added in NFHS 5. The data is published at district level but data on some select indicators is made public only at State level in NFHS 4 & 5. This map displays state-wise percentage of all indicators for NFHS 5, NFHS 4 and the difference. The difference is color coded in two ways. If the growth in number of the indicator in general indicates social progress [Example indicator 7. Population living in household living with electricity] then the color is from red to green. If the growth in number indicates regress or deterioration in social health [Example indicator 125. Ever-married women age 18-49 years who have ever experienced spousal violence (%)] then the color is from green to red. Select the indicator from the drop down and the desired option to view the map.
User can also embed the map with his selected indicator into any website or blog. The district level interactive map will be published on newsbharati very soon. We are also publishing a series of data analysis news on NFHS.
Also see A giant leap towards ODF nation
Indicators not available in NFHS 4
The following indicators are not available in NFHS 4 and difference.
- 6. Deaths in the last 3 years registered with the civil authority (%)
- 13. Children age 5 years who attended pre-primary school during the school year 2019-20 (%)
- 14. Women who are literate%
- 15. Men who are literate%
- 18. Women who have ever used the internet (%)
- 19. Men who have ever used the internet (%)
- 49. Children who received postnatal care from a doctor/nurse/LHV/ANM/midwife/other health personnel within 2 days of delivery (%)
- 63. Children age 24-35 months who have received a second dose of measles-containing vaccine (MCV) (%)
- 64. Children age 12-23 months who have received 3 doses of rotavirus vaccine (%)
- 90. Women who have high risk waist-to-hip ratio (≥0.85) (%)
- 91. Men who have high risk waist-to-hip ratio (≥0.90) (%)
- 99. Blood sugar level - high (141-160 mg/dl)23 (%)
- 100. Blood sugar level - very high (>160 mg/dl)23 (%)
- 101. Blood sugar level - high or very high (>140 mg/dl) or taking medicine to control blood sugar level23 (%)
- 102. Blood sugar level - high (141-160 mg/dl)23 (%)
- 103. Blood sugar level - very high (>160 mg/dl)23 (%)
- 104. Blood sugar level - high or very high (>140 mg/dl) or taking medicine to control blood sugar level23 (%)
- 105. Mildly elevated blood pressure (Systolic 140-159 mm of Hg and/or Diastolic 90-99 mm of Hg) (%)
- 106. Moderately or severely elevated blood pressure (Systolic 160 mm of Hg and/or Diastolic 100 mm of Hg) (%)
- 107. Elevated blood pressure (Systolic 140 mm of Hg and/or Diastolic 90 mm of Hg) or taking medicine to control blood pressure (%)
- 108. Mildly elevated blood pressure (Systolic 140-159 mm of Hg and/or Diastolic 90-99 mm of Hg) (%)
- 109. Moderately or severely elevated blood pressure (Systolic 160 mm of Hg and/or Diastolic 100 mm of Hg) (%)
- 110. Elevated blood pressure (Systolic 140 mm of Hg and/or Diastolic 90 mm of Hg) or taking medicine to control blood pressure (%)
- 111. Ever undergone a screening test for cervical cancer (%)
- 112. Ever undergone a breast examination for breast cancer (%)
- 113. Ever undergone an oral cavity examination for oral cancer (%)
- 114. Ever undergone an oral cavity examination for oral cancer (%)
- 128. Women age 15 years and above who use any kind of tobacco (%)
- 129. Men age 15 years and above who use any kind of tobacco (%)
- 130. Women age 15 years and above who consume alcohol (%)
- 131. Men age 15 years and above who consume alcohol (%)
Data sources:
The main source of data is
Additionally we have used the data from following compilation.